If you haven’t read the article on option strategies in general, that’s a good place to start, then return here. In particular, if you haven’t read the warning about calculating profit that appears at the end of that article, you should go read it now; the way I’m calculating the profit here is correct, but it will lose you points on the CFA exam. Seriously: at least go read the warning.
Payoff Diagram
To illustrate building a bear spread with options, let’s use a specific example:
- X1 = $20
- X2 = $30
Bear Call Spread
We’ll start by building a bear spread with call options. Before we’ve bought or sold any options our payoff is zero, so our starting point to build the bear spread is:
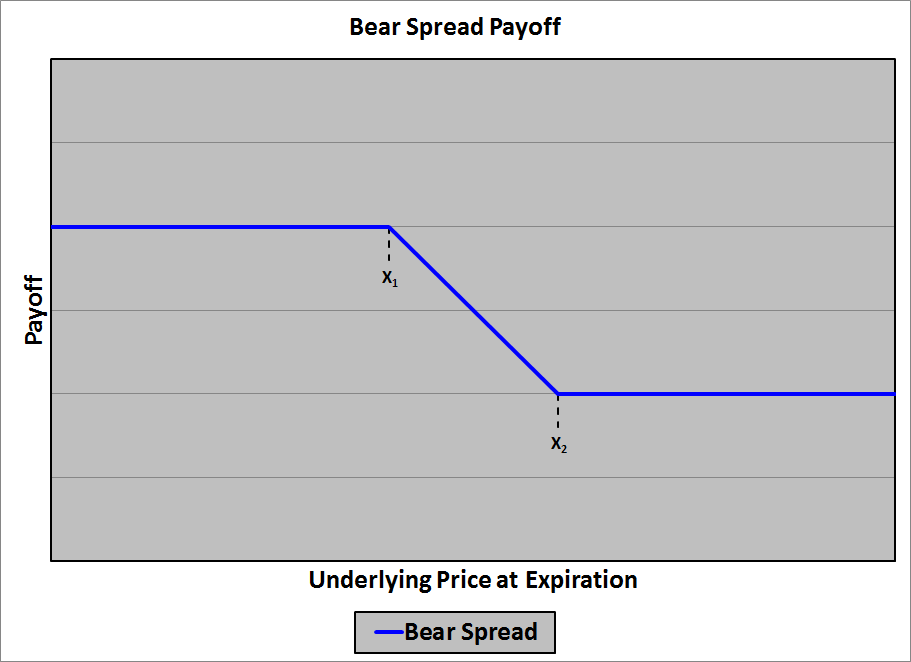
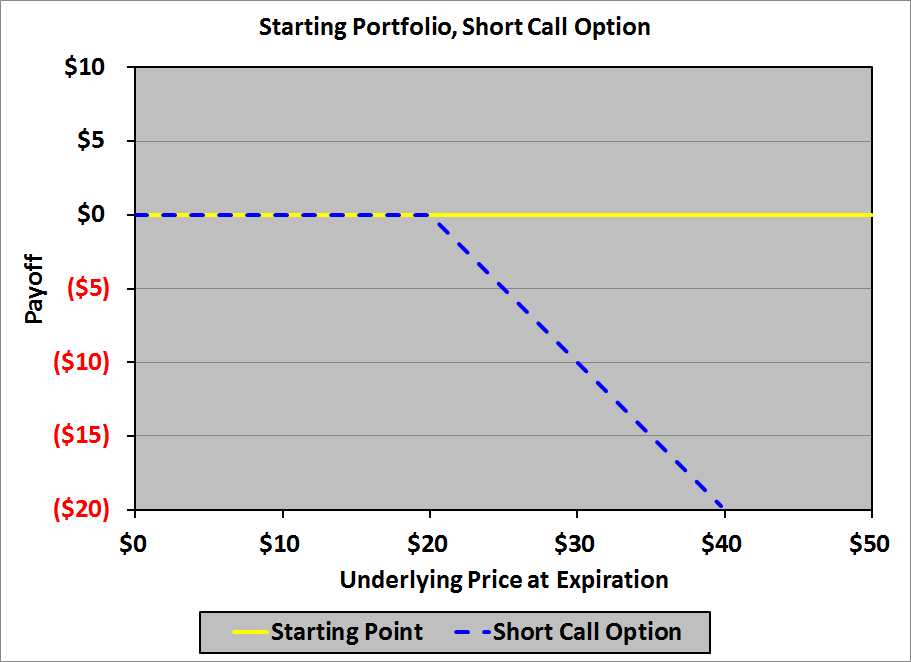
We begin at the left – the payoff when the underlying price at expiration is zero – and move to the right. When we reach $20, we have to add a downward kink to the payoff diagram: down to the right with a slope of −1. To do this, we need an option with a slope of 0 to the left of $20, and a slope of −1 to the right of $20; a short call option with a strike price of $20 is just the ticket:
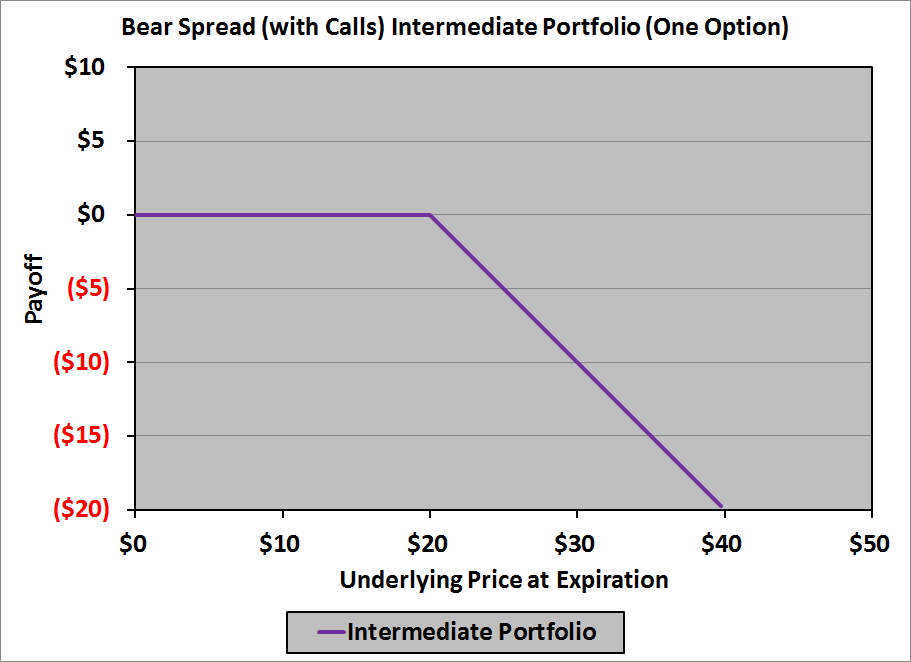
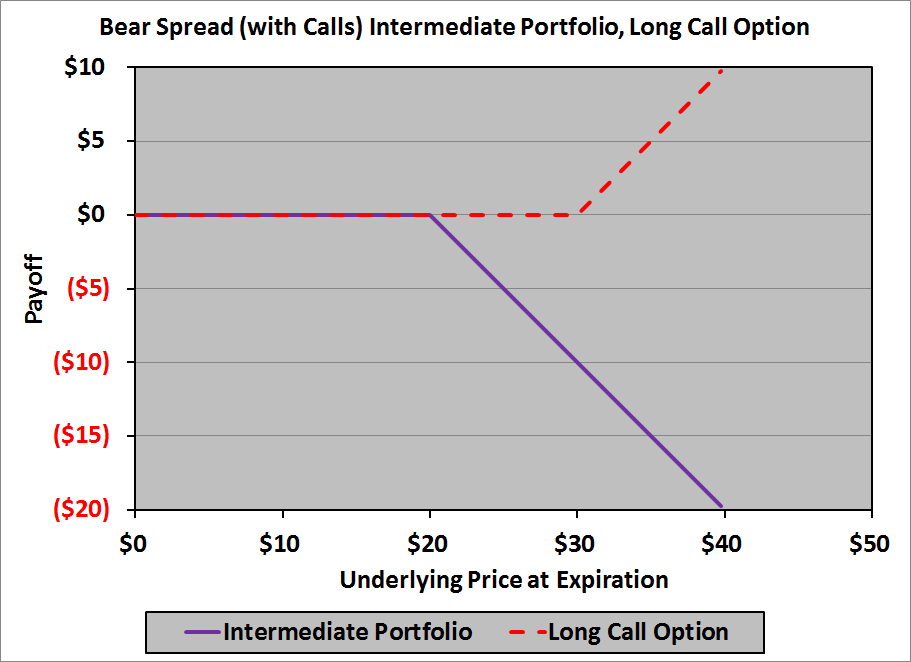
This gives us an intermediate payoff diagram that looks like this:
Moving farther to the right, when we reach $30, we need to add an upward kink to the diagram: back to horizontal with a slope of zero. To do this, we need an option with a slope of 0 to the left of $30, and a slope of +1 to the right of $30; a long call option with a strike price of $30 will wrap it up:
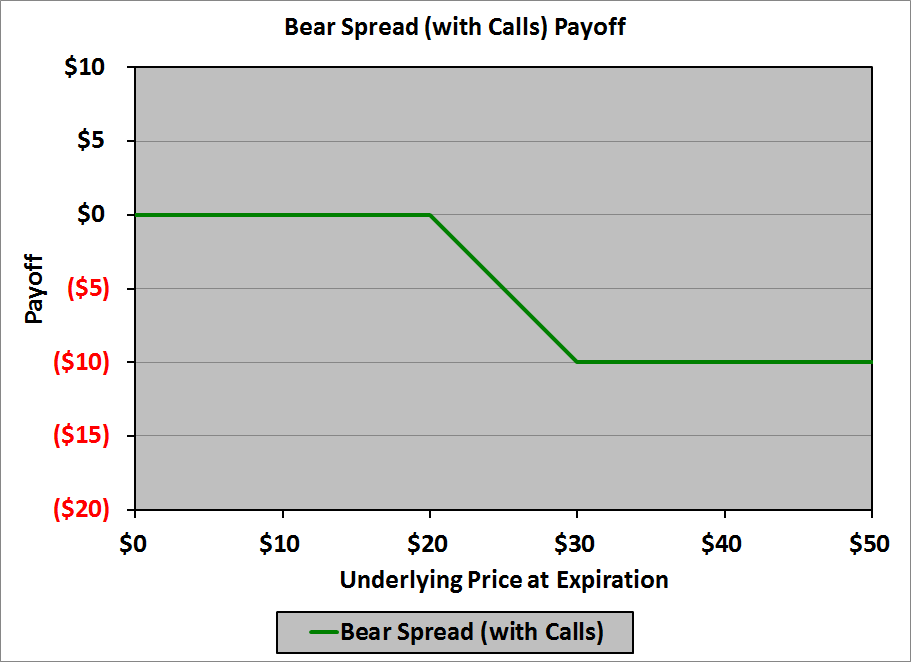
This is the last kink, so we have our payoff diagram:
In a table:
| Underlying Price at Expiration |
Payoff |
| $0 | $0 |
| $20 | $0 |
| $30 | ($10) |
| $50 | ($10) |
Thus, to create the bear spread with calls, we need:
- A short call with a strike price of $20
- A long call with a strike price of $30
More generally, to create a bear spread with calls, we need:
- A short call with a strike price of X1
- A long call with a strike price of X2
Bear Put Spread
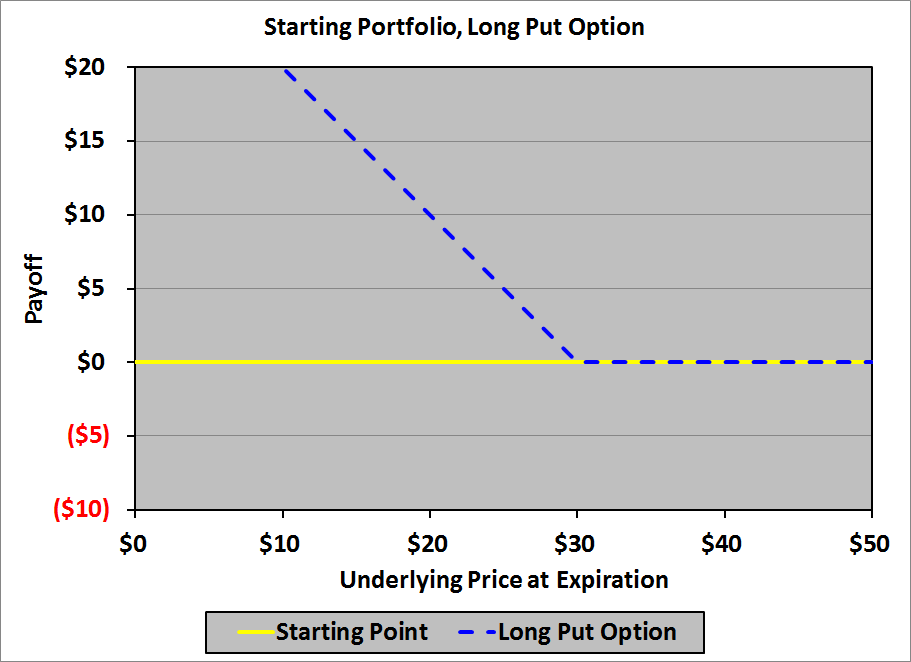
Now let’s create the same bear spread with put options. Our starting point is the same as it was with call options:
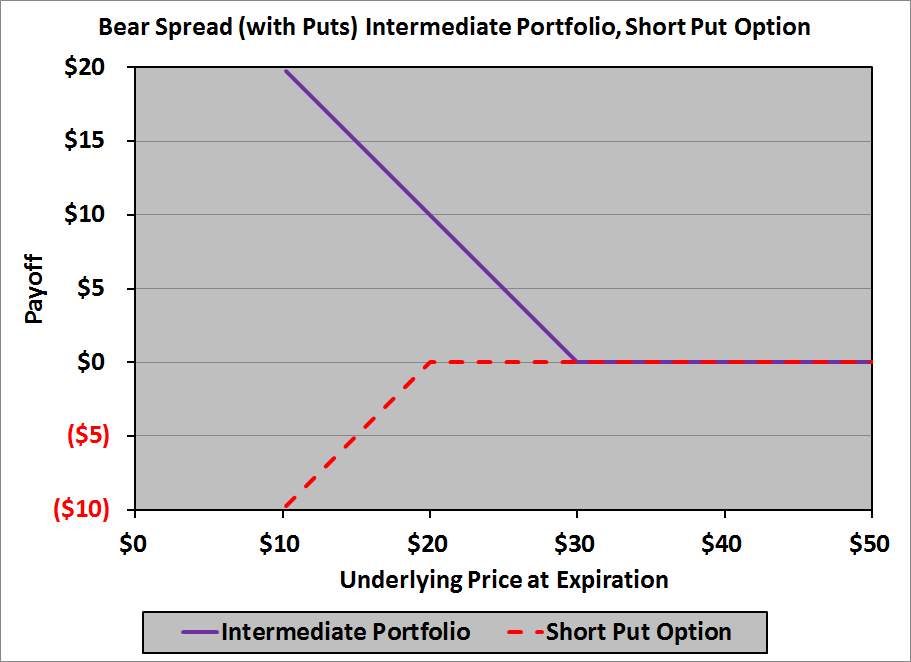
Here, however, we will start at the right – with an underlying price at expiration of $50 – and work our way left. When we get to $30 we need to add an upward kink to the payoff diagram: a slope of −1. We need an option that has a slope of 0 to the right of $30, and a slope of −1 to the left of $30; a long put option with a strike price of $30 will handle it:
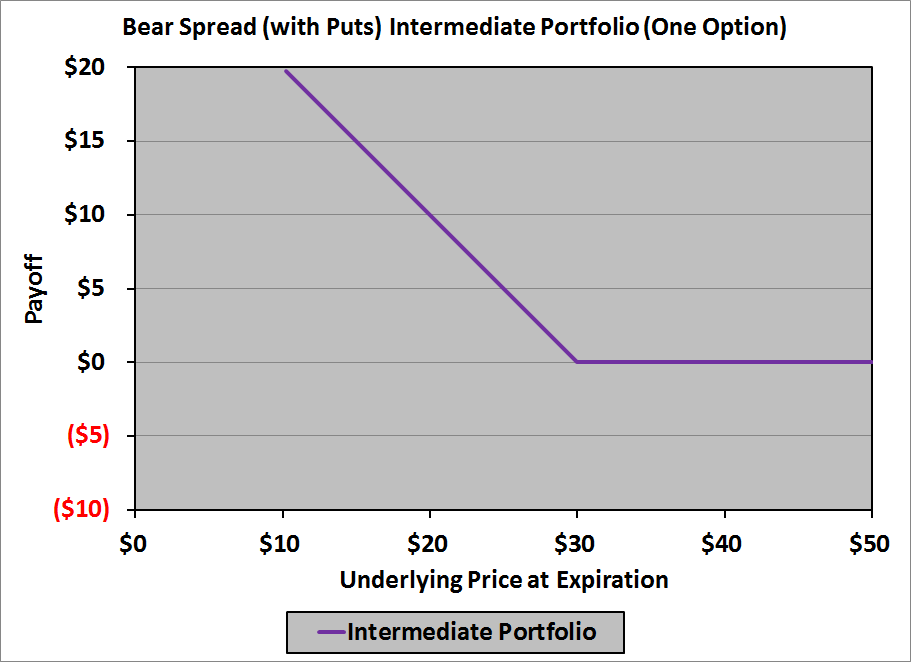
This gives us an intermediate payoff diagram that looks like this:
Moving farther to the left, when we reach $20, we need to add a downward kink to the diagram: back to horizontal with a slope of zero. To do this, we need an option with a slope of 0 to the right of $20, and a slope of 1 to the left of $20; a short put option with a strike price of $20 puts a bow on it:
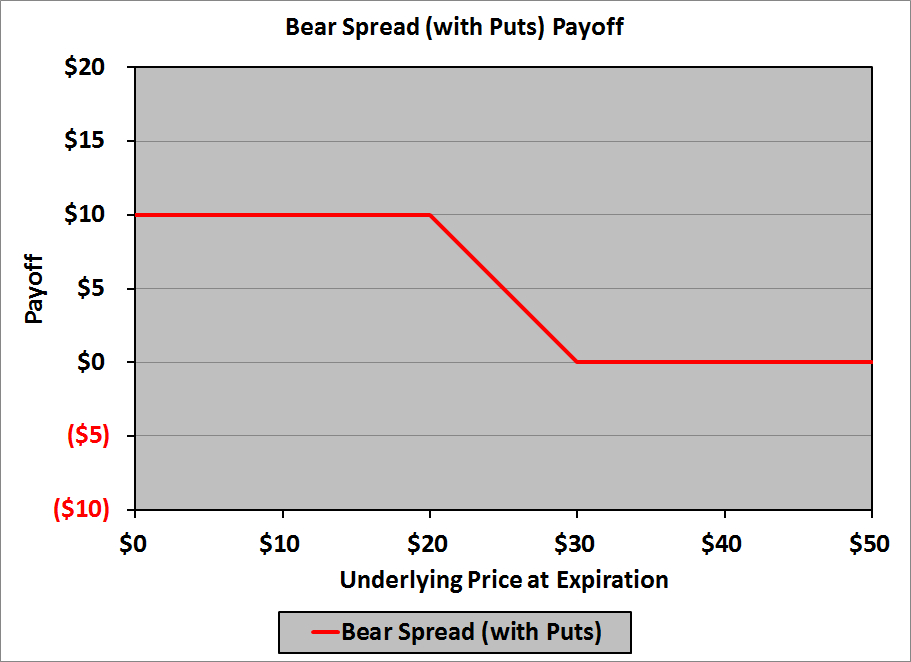
This is the last kink, so we have our payoff diagram:
In a table:
| Underlying Price at Expiration |
Payoff |
| $0 | $10 |
| $20 | $10 |
| $30 | $0 |
| $50 | $0 |
Thus, to create the bear spread with puts, we need:
- A short put with a strike price of $20
- A long put with a strike price of $30
More generally, to create a bear spread with puts, we need:
- A short put with a strike price of X1
- A long put with a strike price of X2
Although the payoff diagrams aren’t identical – the payoff with puts is $10 above the payoff with calls for every price of the underlying at expiration – it turns out that the profit diagrams are identical (unless there are mispriced options and, therefore, an arbitrage opportunity) as we’ll see in a moment.
Profit Diagram
To construct the profit diagram, we need to know the cost of each of the options used in constructing the payoff diagram. For our example, the option costs are derived using the Black-Scholes-Merton pricing model with these parameters:
- Current price of the underlying: $25
- Annual (effective) risk-free interest rate: 2.0%
- Time to expiration: 6 months
- Annual volatility of underlying’s returns: 30%
The option costs are:
| Option Type |
Strike Price |
Option Cost |
| Call | $20 | $5.52 |
| Call | $30 | $0.68 |
| Put | $20 | $0.32 |
| Put | $30 | $5.38 |
The future value (at expiration of the options) of the (net) cost of the option strategy is subtracted from the payoff at each point to get the profit at that point.
Bear Call Spread
The options needed for the bear spread constructed with calls are a short call with a strike of $20 and a long call with a strike of $30. The net cost of the bear call spread today is:
\[\$0.68\ -\ \$5.52\ =\ -\$4.84\]
(Note that this is a negative number: the bear call spread actually generates cash today.) The future value (in 6 months, at 2% effective annual interest) of the cost is:
\[-\$4.84\ ×\ 1.02^{6/12}\ =\ -\$4.89\]
(Note that this is the step you omit on the CFA exam; use −$4.84, not −$4.89.)
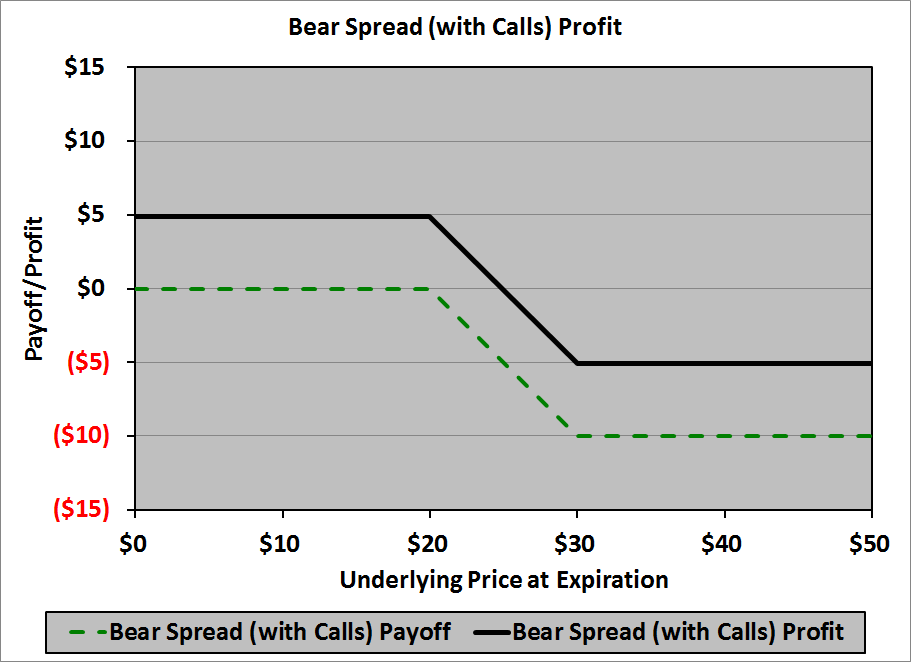
The profit diagram is:
In a table:
| Underlying Price at Expiration |
Profit |
| $0 | $4.89 |
| $20 | $4.89 |
| $30 | ($5.11) |
| $50 | ($5.11) |
Bear Put Spread
The options needed for the bear spread constructed with puts are a short put with a strike of $20 and a long put with a strike of $30. The net cost of the bear call spread today is:
\[\$5.38\ -\ \$0.32\ =\ \$5.06\]
The future value (in 6 months, at 2% effective annual interest) of the cost is:
\[\$5.06\ ×\ 1.02^{6/12}\ =\ \$5.11\]
(Note that this is the step you omit on the CFA exam; use $5.06, not $5.11.)
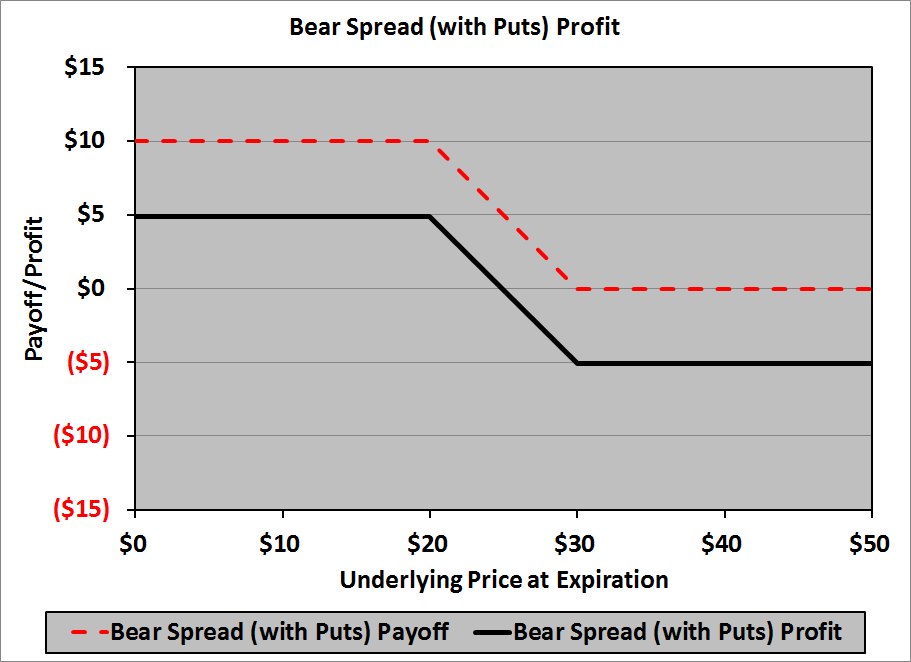
The profit diagram is:
In a table:
| Underlying Price at Expiration |
Profit |
| $0 | $4.89 |
| $20 | $4.89 |
| $30 | ($5.11) |
| $50 | ($5.11) |
Note that the profit of the bear put spread is identical to the profit of the bear call spread no matter the price of the underlying at expiration. This has to happen, of course, if the options are fairly priced today; if the profits were different, there would be an arbitrage opportunity: buy the bear spread with the higher profit and sell the bear spread with the lower profit.
Thus, we can talk about the profit of a bear spread, without having to concern ourselves with whether the spread is constructed with calls or puts.
Breakeven Price of the Underlying at Expiration
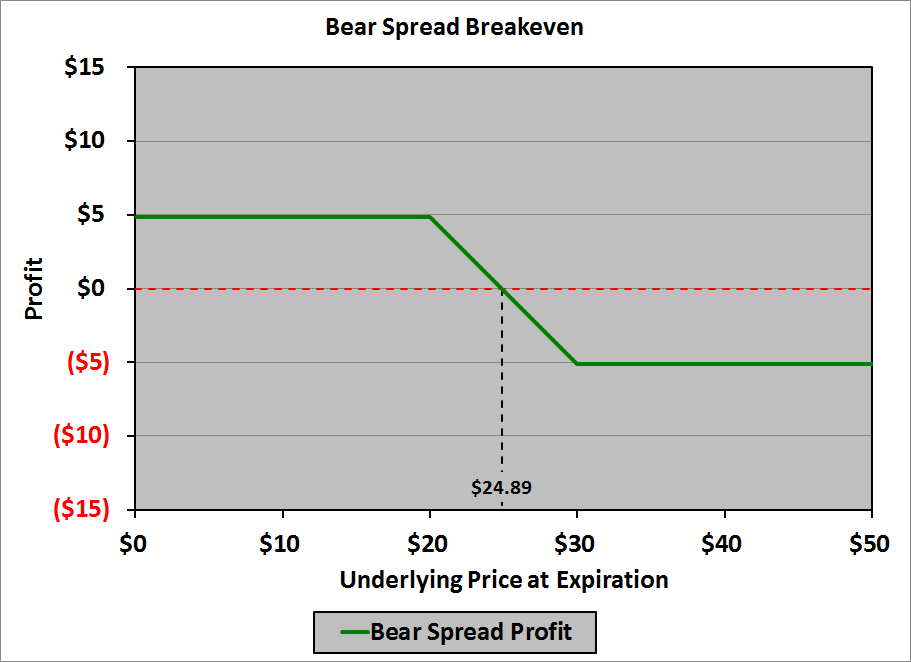
Our next concern is the price of the underlying at expiration at which we will break even in the bear spread. Graphically, it looks like this:
In general, the breakeven point will occur at an underlying price between X1 and X2 (between $20 and $30 in our example). Calculating the breakeven price of the underlying at expiration relies on the fact that the middle section of the profit graph has a slope of −1. The profit is $4.89 when the underlying price at expiration is $20. To get to a profit of zero, therefore, we must increase the underlying price by $4.89; thus, the breakeven price of the underlying at expiration is:
\[\$20.00\ +\ \$4.89\ =\ \$24.89\]
Note, too, that we could start at $30 where the profit is −$5.11; we would need to decrease the underlying price by $5.11 to get a profit of zero; thus, the breakeven price of the underlying at expiration can also be calculated as:
\[\$30.00\ -\ \$5.11\ =\ \$24.89\]
In general, the breakeven price will be:
\begin{align}Breakeven\ price\ &=\ X_1\ +\ Profit\ at\ X_1\\
\\
&=\ X_2\ -\ Loss\ at\ X_2
\end{align}
Maximum Profit and Maximum Loss
Our next concern is the maximum profit achievable or loss incurrable in a bear spread. The easiest way to determine the conditions under which each would occur is to look at the profit diagram: the maximum profit occurs at X1 ($20 in our example) and the maximum loss occurs at X2 ($30 in our example).
To compute the maximum profit, simply compute the payoff of the constituent options at X1, then subtract the net cost of the options. To compute the maximum loss, simply compute the payoff of the constituent options at X2, then subtract the net cost of the options.
In our example, if we built the bear spread using call options:
| Underlying Price at Expiration | Payoff on $20 Call |
Payoff on $30 Call |
Total Payoff |
Option Cost |
Profit |
| $20 | $0 | $0 | $0 | $4.89 | $4.89 |
| $30 | ($10) | $0 | ($10) | $4.89 | ($5.11) |
Thus, the maximum profit is $4.89, and the maximum loss is $5.11.
If we built the bear spread using put options:
| Underlying Price at Expiration | Payoff on $20 Put |
Payoff on $30 Put |
Total Payoff |
Option Cost |
Profit |
| $20 | $0 | $10 | $10 | ($5.11) | $4.89 |
| $30 | $0 | $0 | $0 | ($5.11) | ($5.11) |
Again, the maximum profit is $4.89, and the maximum loss is $5.11.
The Greeks
Based on the Black-Scholes-Merton pricing model, the Greeks for the options used are:
| Option Type | Strike Price | Delta | Gamma | Theta | Vega | Rho |
| Call | $20.00 | 0.8858 | 0.0364 | −1.3533 | 3.4136 | 8.3126 |
| Call | $30.00 | 0.2399 | 0.0586 | −1.7535 | 5.4939 | 2.6598 |
| Put | $20.00 | −0.1142 | 0.0364 | −0.9612 | 3.4136 | −1.5889 |
| Put | $30.00 | −0.7601 | 0.0586 | −1.1653 | 5.4939 | −12.1924 |
and the Greeks for the two bear spreads are:
| Spread | Delta | Gamma | Theta | Vega | Rho |
| Bear Put Spread | −0.6460 | 0.0222 | −0.4002 | 2.0802 | −5.6528 |
| Bear Call Spread | −0.6460 | 0.0222 | −0.2041 | 2.0802 | −10.6035 |
Note, in particular, that delta, gamma, and vega are the same irrespective of the types of options used to create the bear spread. I’ve come across posts from candidates (presumably options traders) who have said that, for example, in a bear put spread you’re long vega while in a bear call spread you’re short vega (or maybe it was the other way round). That’s nonsense, as you can see. Theta and rho are different, but that’s understandable: in a bear put spread your initial value is positive (you paid good money for it), while in a bear call spread your initial value is negative, and you’re moving toward the same value (profit) at expiration.
Also note that delta is negative, confirming the bearishness of this strategy.
What’s the Point?
Why would you choose to employ a bear spread strategy?
You would employ a bear spread if you have a mild belief that the price of the underlying is going to decrease, but you’re concerned that the price may increase. The spread protects your downside (and, presumably, your backside), while:
- Giving you some upside potential, and
- Not costing you a lot.
Note that if you had a strong belief that the price of the underlying were going to decrease, you could simply purchase a put option, or create a synthetic short position (buy a put and sell a call with the same strike price, close to today’s spot price). A bear spread suggests a tempered (mild) belief in the depreciation of the underlying, coupled with caution.
